How can you turn transportation data into meaningful KPIs for your business?
18 November 2026
updated at: 11 August 2026
10 min
There’s usually a lot of data in logistics. There are orders, routes, shipments, statuses, documents, rates, invoices, deviations, incidents, driver comments, and correspondence with carriers. But a large amount of data alone doesn’t help manage a business. A manager doesn’t need a collection of disparate spreadsheets. They need to understand whether logistics operations are being completed on time, how much they cost, where deviations occur, and what solutions will help improve results.
This is precisely where KPIs come into play. A good KPI doesn’t just record a fact. It helps you see the state of the process, compare the result to the goal, and understand where action is needed. In logistics, this is especially important because a single failure rarely remains confined to a single department. A delay in loading affects delivery; downtime affects costs; errors in documentation delay closing out a shipment; and an unreliable carrier increases the workload on the entire team.
For transportation data to become meaningful KPIs for the business, it must be integrated into a unified management model: from the request and route to actual execution, documentation, and costs.

Why Standard Reports Are Insufficient
A classic problem with logistics analytics is that reports are often compiled after the fact. At the end of the week or month, the team exports the data, compiles it in Excel, checks statuses, identifies the causes of delays, and manually calculates metrics. This approach provides insight into the past period but does little to help manage current shipments.
There’s another problem: different departments view logistics through the lens of different data. For a logistics specialist, statuses and deviations are important. For a manager—SLAs, costs, and team efficiency. For Finance, it’s invoices, accruals, source documents, and the accuracy of month-end closing. For the Sales and Marketing team, it’s customer service quality and the impact of shipments on margins. If everyone compiles their own version of the report, the business ends up with several different views of the same process.
KPIs only work when they are derived from linked operational data. Delays must be linked to a specific shipment, stage, performer, and cause. Costs must be linked to the rate, charges, additional expenses, and the fact of completion. A document must be linked not just to a counterparty, but to a specific trip, order, or delivery.
What KPIs Does Logistics Really Need?
The first level consists of performance metrics. These answer the question of whether logistics is meeting its commitments in terms of deadlines. These include the percentage of on-time deliveries, the number of late shipments, the average deviation from the scheduled date, the proportion of shipments without critical incidents, adherence to time windows, and the completion of route stages according to plan.
The second level consists of cost metrics. These show how much logistics costs and where deviations from estimates occur. These include the cost of transportation per route, the cost per order or unit of cargo, the variance between actual and planned costs, additional expenses, the proportion of costs attributable to third-party carriers, the cost-effectiveness of in-house transportation, and profitability per trip, customer, or route.
The third level consists of service provider quality metrics. A carrier should not be evaluated solely on price. For businesses, what matters is the consistency of transportation availability, adherence to deadlines, the completeness of status updates, the number of incidents, the timeliness of documentation, and the frequency of disputes. This data helps you choose a carrier based on facts, not impressions.
The fourth level consists of process manageability metrics. These indicate the extent to which the team controls the supply chain. For example: how many shipments are in progress, how many require attention, where there have been no updates for longer than the allowable period, which documents are pending, which tasks are overdue, and which deliveries are at risk of missing their deadlines.
Example of KPI Management Logic
| Control Zone | KPI | What It Tells the Business | Where to Look for the Cause |
| Deadlines | On-time delivery rate | Is the promised service level being met? | Transportation, stage, route point, carrier |
| Costs | Actual vs. Plan | Where logistics exceed the budget | Rate, additional operation, downtime, route change |
| Carriers | Performance Rating | Who Consistently Meets Their Commitments | Timelines, incidents, documents, completeness of events |
| Documents | Unsettled Shipments | What Hinders Financial Closure | Source document, invoice, accrual, person in charge |
How SimpleTMS Helps Generate KPIs from Operational Data
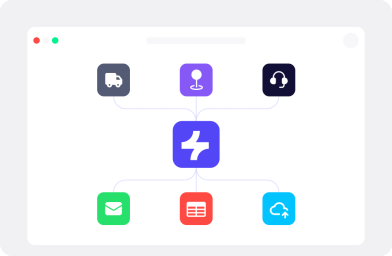
In SimpleTMS, shipment data isn’t isolated from the process. Orders, cargo, routes, carriers, transportation, scheduled dates, actual events, documents, rates, accruals, and invoices are all interconnected. Thanks to this, KPIs can be generated not as standalone reports, but as a reflection of the actual process.
For example, if you need to calculate the percentage of on-time deliveries, the system relies not on a manual entry in a table, but on scheduled and actual dates in the shipment and delivery records. If you need to understand the reasons for delays, you can drill down from an aggregate metric to specific shipments, stages, route points, and responsible parties.
When a company analyzes costs, SimpleTMS links each shipment to rates, charges, additional expenses, invoices, and documents. This allows you to see not only the total amount but also the breakdown of variances: where the rate changed, where an additional operation occurred, where downtime occurred, and where the actual cost differs from the preliminary calculation.
To evaluate carriers, the system can use performance history: on-time delivery, statuses, incidents, documents, quality of order completion, and transportation economics. Such a rating becomes a practical tool for tenders and contractor selection because it shows not only the price but also the actual quality of work.

Control Tower: From Metrics to Action
Control Tower isn’t just for displaying pretty graphs. Its value lies in linking KPIs to specific objects and actions. A manager sees the big picture regarding deadlines, costs, and deviations. A logistics specialist sees a list of shipments that require attention. The finance department sees open documents, invoices, and charges. Everyone works with the same data logic, but each receives their own management perspective.
This approach changes the nature of analytics. Instead of asking, “Why did expenses increase last month?” you can see in which areas the increase occurred, which carriers were more prone to deviations, which additional operations affected the cost, and where the terms of execution changed.
Instead of a general indicator like “there are delays,” you can see which shipments are at risk, at what stage the delay occurred, who is responsible for the next action, and which documents or events have not yet been entered.
For businesses, this means that KPIs are no longer just reporting for the sake of reporting, but rather a practical management tool. The metric highlights the problem, the details explain the cause, and the linked shipment card allows you to take action.

How to Make KPIs Understandable for the Business
A good logistics KPI should answer a clear management question. Not “how many lines in the report have a ‘completed’ status,” but “what percentage of shipments were delivered on time.” Not “how many invoices were created,” but “which completed shipments have not yet been financially settled.” Not “how many carriers participated in the bidding,” but “which carriers consistently meet their obligations regarding deadlines and documentation.”
Therefore, it’s best to build KPIs based on business objectives. If the goal is to reduce costs, you need metrics on costs by route, deviations from the planned price, additional expenses, and profitability. If the goal is to improve service quality, on-time deliveries, adherence to time windows, incidents, and response times are important. If the goal is to manage contractors, you need carrier ratings, performance history, and the quality of document management.
SimpleTMS helps link these goals to the data that is already generated during the workflow. The logistics specialist doesn’t fill out a separate report just for the sake of KPIs. They manage orders, plan shipments, monitor execution, record documents, and close out invoices. Based on these actions, the system generates metrics for managers and the business.

Examples of KPIs for Different Process Participants
For a logistics manager, overall efficiency metrics are important: the percentage of on-time deliveries, the number of shipments with deviations, actual costs versus budget, transportation costs by route, utilization of the company’s own fleet, the quality of carriers’ work, and the number of open documents.
For an operations logistics specialist, monitoring KPIs are useful: shipments at risk, missing events, overdue stages, unresolved incidents, trips without supporting documents, and shipments with route or cost changes.
For the finance department, closing metrics are important: shipments completed but not closed, invoices under review, discrepancies between the rate and actual costs, additional charges, documents not linked to a shipment, and overdue source documents.
For the sales and customer service teams, key metrics include SLAs, on-time delivery, quality of customer service, number of complaints, transparency of statuses, and the impact of logistics on profit margins.

Conclusion
Shipping data becomes useful for the business only when it is transformed into meaningful metrics: timelines, costs, service provider quality, process manageability, and financial closure. Simply collecting data in a report is not enough. It must be linked to orders, shipments, stages, documents, rates, charges, and responsible parties.
SimpleTMS helps build this integration within a unified system. Operational activities become a source of analytics; analytics are transformed into KPIs; and KPIs enable logistics management based on facts rather than disparate reports.
When a manager sees not only the numbers but also the cause, the subject, and the person responsible, KPIs cease to be a mere formality. They become a tool for managing logistics and a way to demonstrate the true value of the transportation function to the business.